Data Arrangement for Analysis
Proper data arrangement is crucial for running statistical analyses like Randomized Block Design (RBD) and Factorial Randomized Block Design (FRBD). This guide illustrates how to transform your raw data into a format suitable for our analysis tools.
Randomized Complete Block Design (RCBD)
Raw Data Format
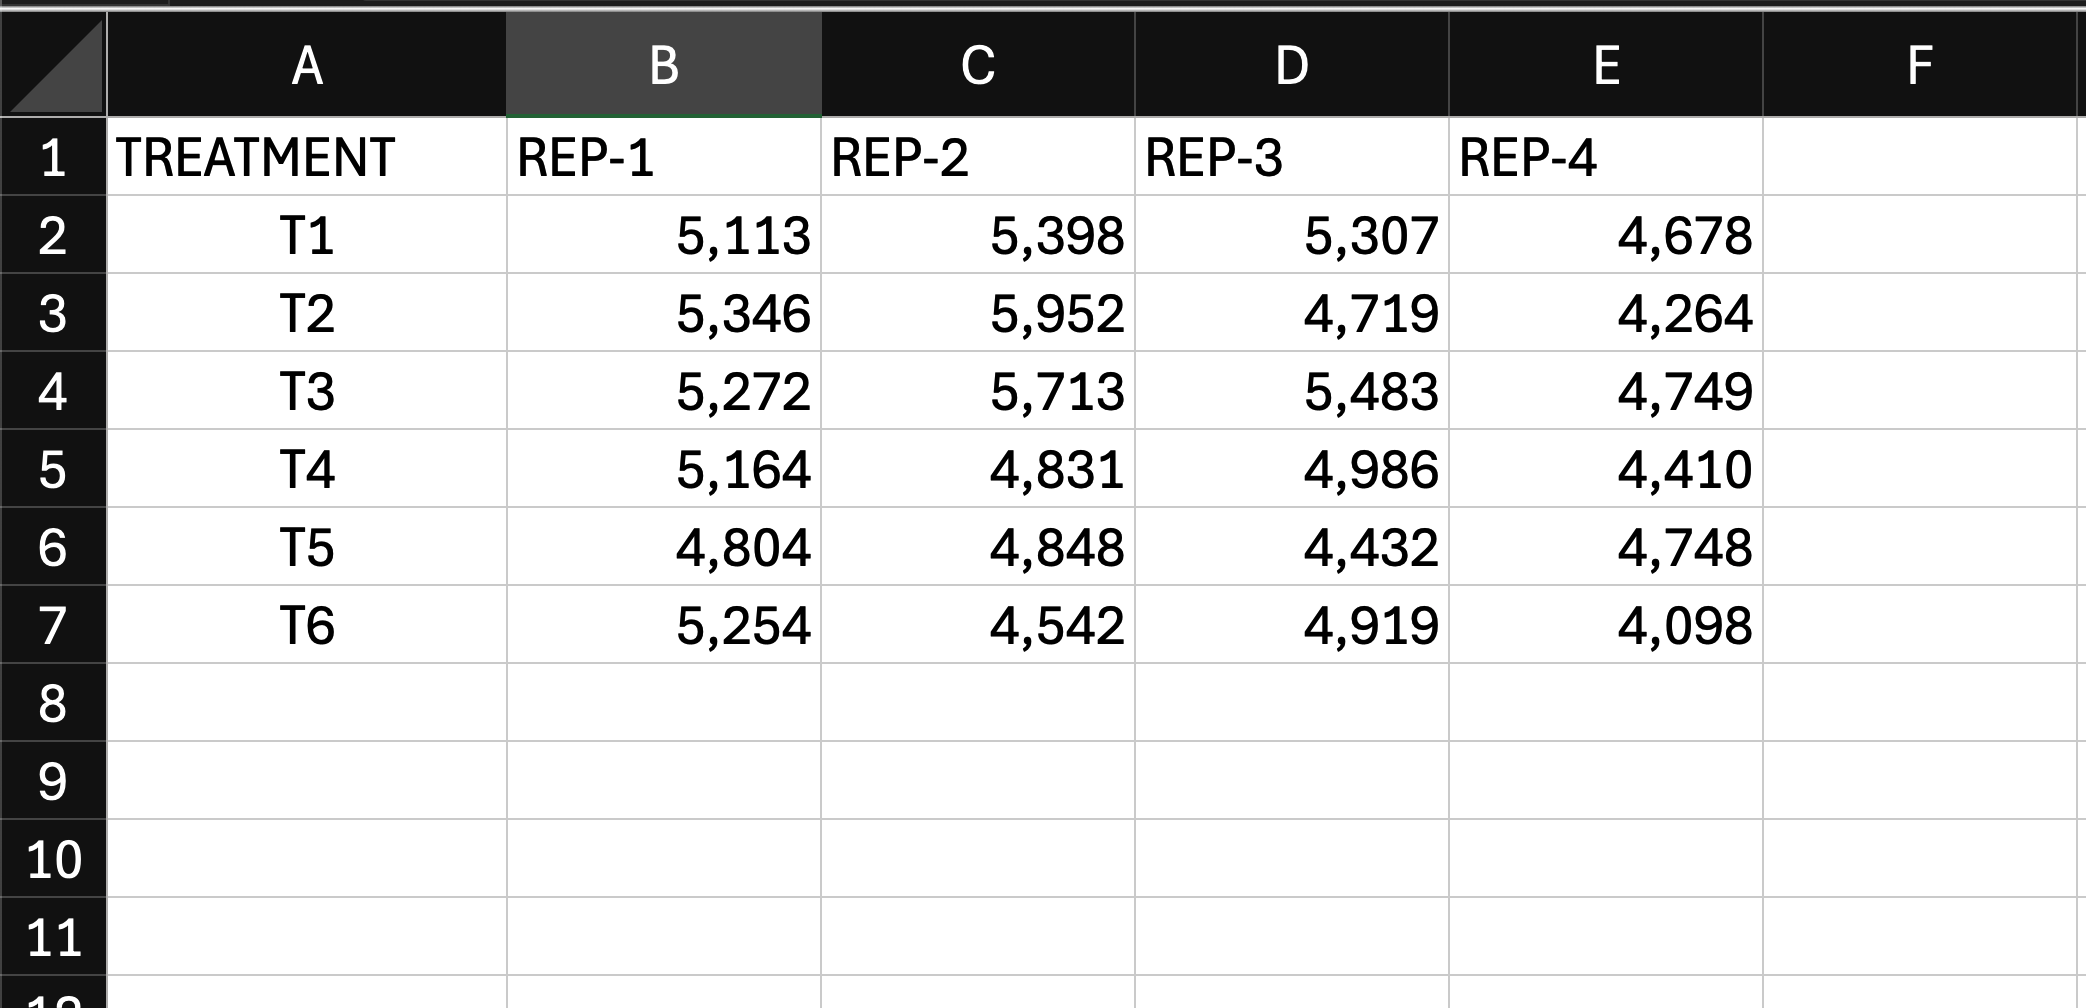
Typically, raw data from field trials is arranged with treatments as columns and blocks as rows. That format is not suitable for our analysis tool.
Below is an example dataset. The data was gathered from a field experiment where six different seed rates were tested in randomized block design, each with four replications. Here seed rate is the "factor" and replication is the "block". The "values" are grain yields measured in kg/ha. (source: Gomez & Gomez, 1984, p. 26)
To use this data in our tool, you need to convert it into a "melted" format, as shown in the image in right. You can either do it manually or use a tool like INSIO
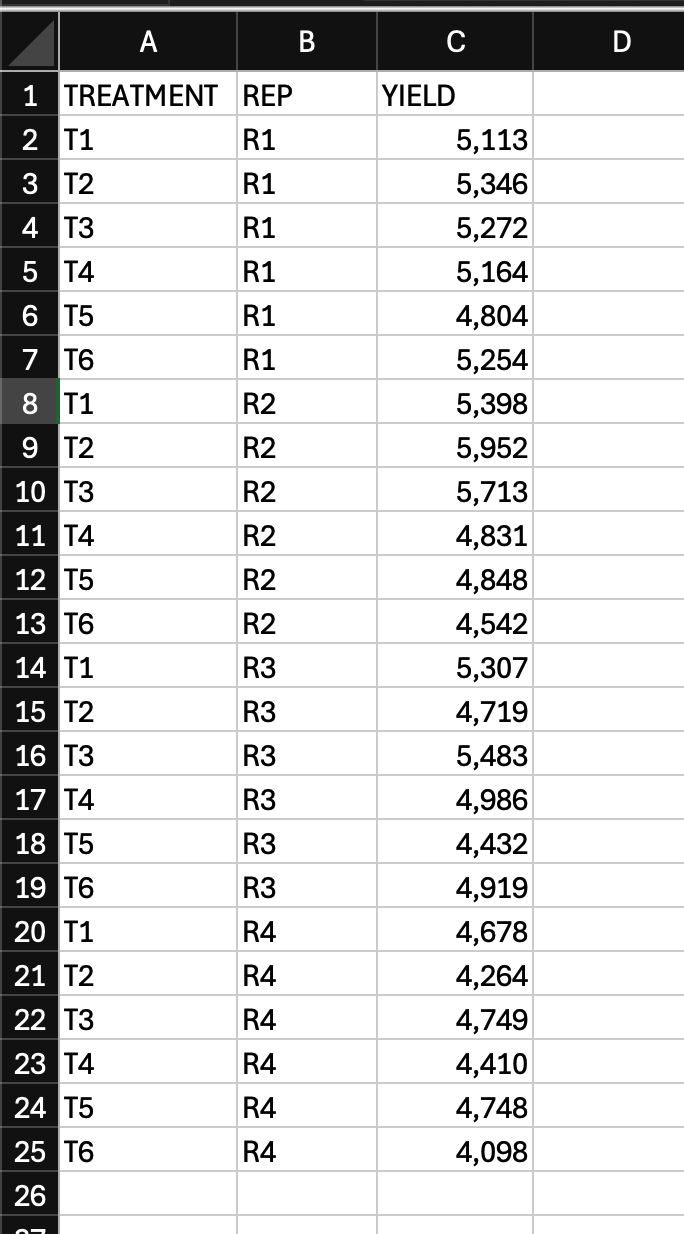
Melted Data Format
For our tool, you need to "melt" the data into a long format with three columns: Treatment (factor), Replication (block), and Yield (value).
Factorial RBD (FRBD)
Raw Data Format
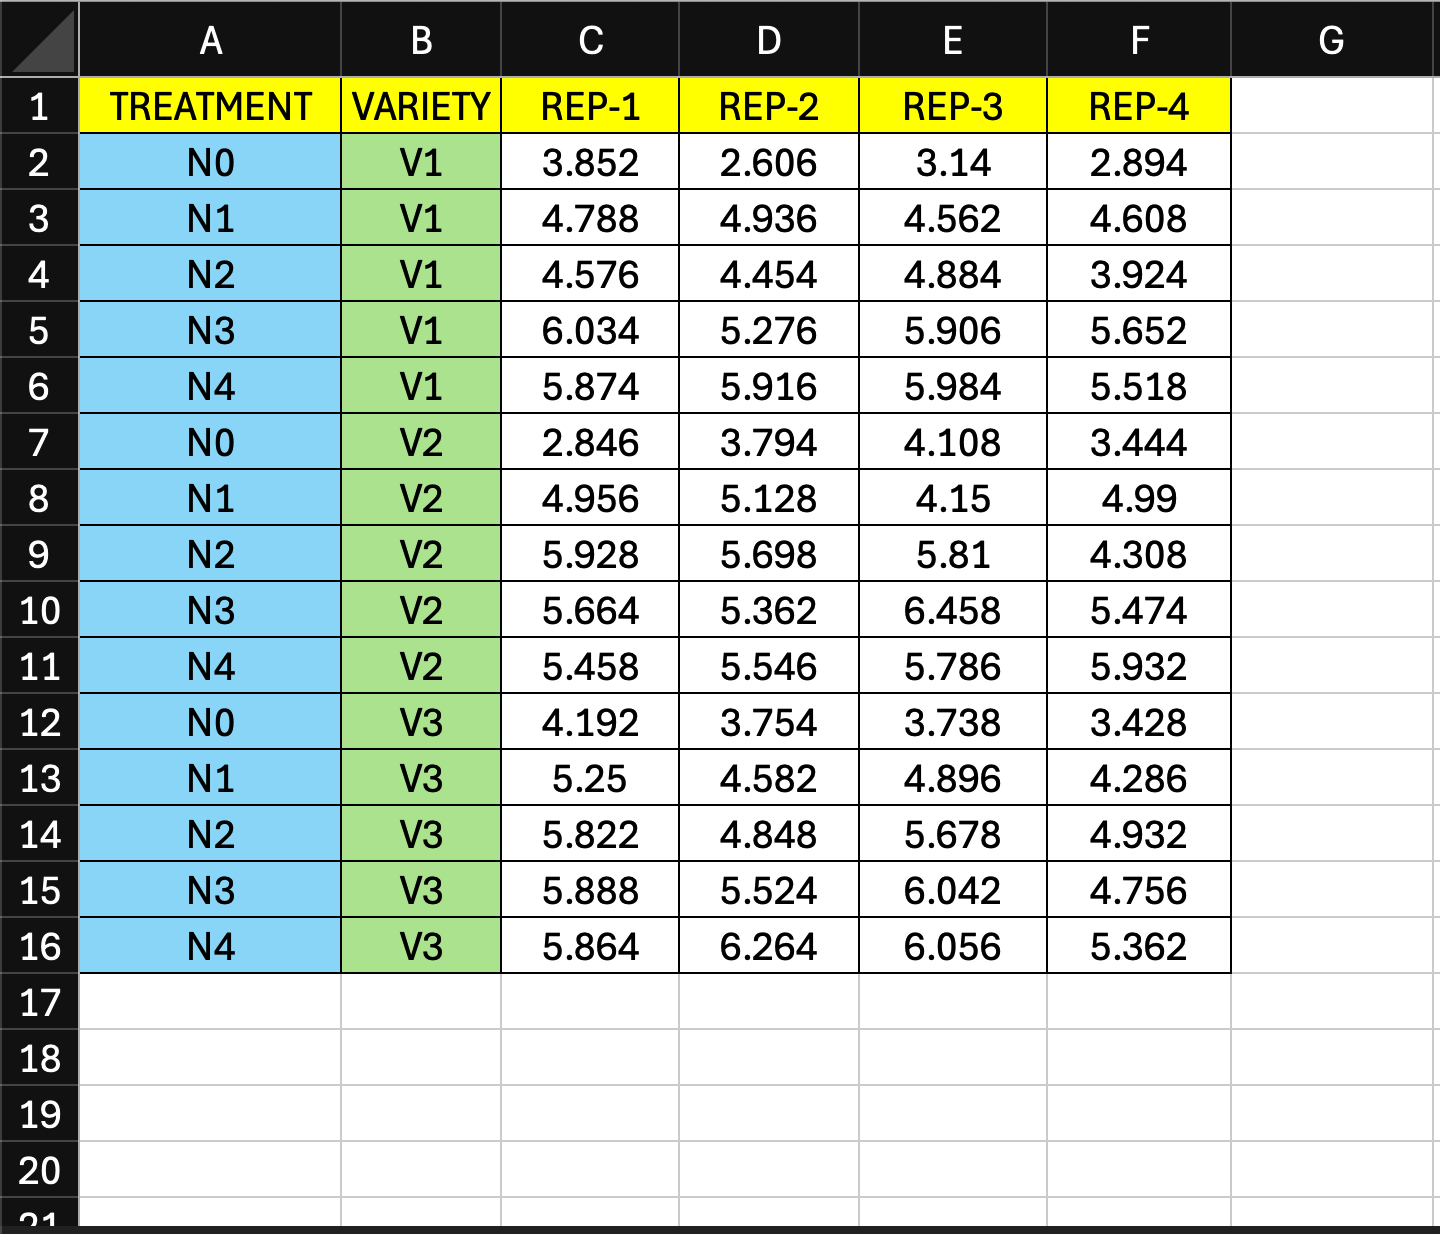
FRBD data is often more complex, with multiple factors in columns.
Below is an example dataset. The data was gathered from a field experiment where three different varieties were tested with five levels of nitrogen in a factorial randomized block design, each replicated four times. Here nitrogen level is "factor 1", variety is "factor 2" and replication is the "block". The "values" are grain yields measured in t/ha. (source: Gomez & Gomez, 1984, p. 92)
To use this data in our tool, you need to convert it into a "melted" format, as shown in the image in right. You can either do it manually or use a tool like INSIO
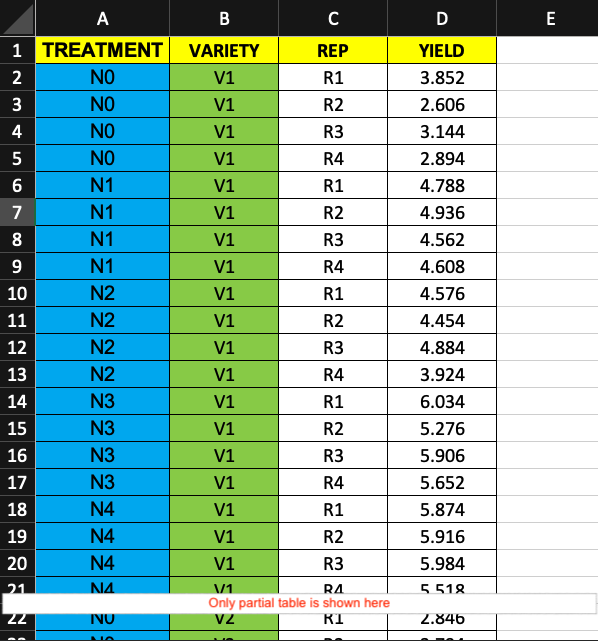
Melted Data Format
The melted format for FRBD requires columns for each factor, plus columns for Block and Value.